
• Skip to primary navigation
  • Skip to main content
  • Home
  • People
  • Facilities
    • Anechoic Chamber
    • Microwave and Millimeter Wave Metrology Lab
    • Rapid Prototyping and Machining
    • Visualization Studio
    • Instructional Lab
    • Equipment
      • Reservation
      • Training
    • Policies
  • Measurement Services
    • Antenna Measurement Services
    • Dielectric Constant (Dk) & Loss Tangent (Df) Testing Services
      • Parallel Plate Dielectric Testing: ASTM D150, 20 Hz to 13 MHz
      • DAK-TL2 Coaxial Probe Dielectric Testing: Liquids and Lossy Materials, 4 MHz to 67 GHz
      • WR-90 Waveguide Dielectric Testing: Dk, Df & Permeability
      • SPDR Thin Film Dielectric Testing: Dk & Df at 10 GHz
      • High-Precision FPOR for Broadband Dk and Df Testing (10.2 – 52.2 GHz)
    • S-Parameters and System-Level Testing
  • Membership and Facility Usage
  • Contact Us

Intelligent Electromagnetic Sensor Laboratories (iEMSL)

Texas A&M University College of Engineering

Material Characterization Examples

Measured dielectric constant (Dk) and loss tangent (Df) from real samples run at iEMSL, published with the spread across repeat measurements so you can see the repeatability rather than a single headline figure. The materials below were measured by three methods: WR-90 waveguide transmission line across the X-band, split post dielectric resonator at 10 GHz, and Fabry-Perot open resonator from 10.2 to 52.2 GHz.

For sample requirements, frequency coverage and pricing for each method, see dielectric constant and loss tangent testing services.

WR-90 Waveguide Transmission Line

WR-90 waveguides are limited to the X-band (8-12GHz), so all results are within this range.

► Rogers RT/Duroid 6010LM

High dielectric constant (dk = 10.2), low loss laminate. Thickness of 1.9mm. Ideal for operating at X-band and below.
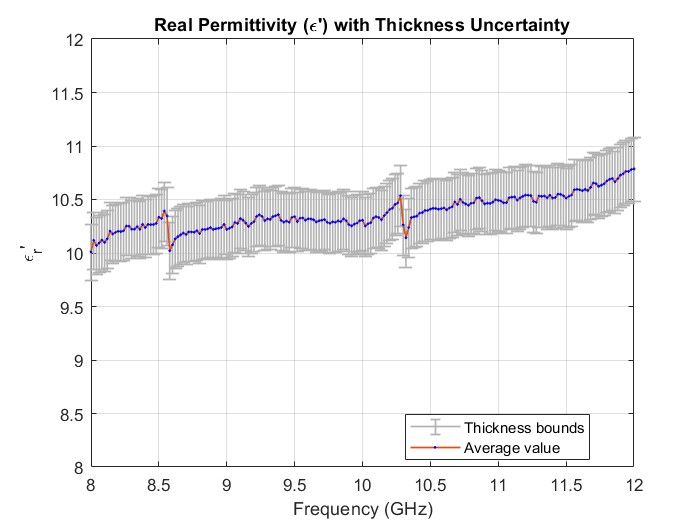
Measured dielectric constant of Rogers RT/duroid 6010LM plotted against frequency across the X-band, 8 to 12 GHz, by WR-90 waveguide transmission line, with error bars at each point. The sample is a 1.9 mm laminate with a nominal dielectric constant of 10.2.
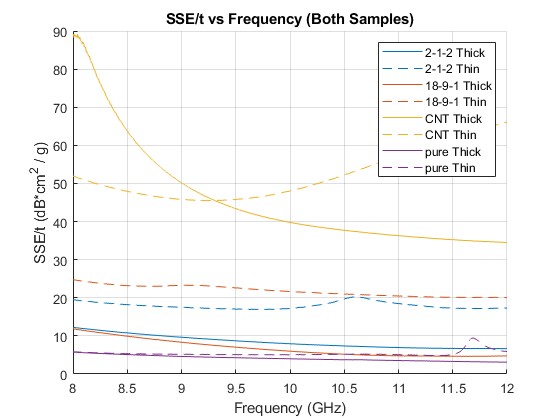
► Shielding Effectiveness of Carbon Nanotubes and Polymer Composites

Shielding effectiveness measurements of carbon nanotubes and polymer composites both as a ratio and as a function of material thickness.
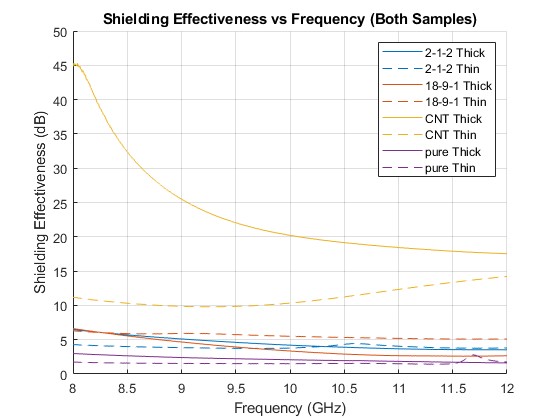
Measured shielding effectiveness of carbon nanotube and polymer composites plotted against frequency across the X-band, 8 to 12 GHz, by WR-90 waveguide transmission line, expressed as a ratio.
Measured shielding effectiveness of carbon nanotube and polymer composites plotted against material thickness, measured across the X-band, 8 to 12 GHz, by WR-90 waveguide transmission line.

Split Post Dielectric Resonator

Measurements on the SPDR are single frequency (10GHz).

► Cyclic Olefin Polymer (COP) – 100µm

COP is a transparent plastic resin with very low water absorption and loss tangent. It typically has a real permittivity between 2.1 and 2.4.

Cyclic olefin polymer (COP), 100 µm film, measured by split post dielectric resonator at 10 GHz.
COP Average Minimum Maximum
Thickness 100µm 99µm 101µm
Permittivity 2.3495 2.3363 2.3631
Loss Tangent 5.78078E-4 5.75636E-4 5.80509E-4

Download the COP measurement data, or see SPDR thin film dielectric testing for sample requirements and pricing.

► High Impact Polystyrene (HIPS) – 235.7µm

HIPS has properties of high impact strength. It is a low-cost, rigid thermoplastic with good dimensional stability and an expected real permittivity of 2.51.

High impact polystyrene (HIPS), 235.7 µm film, measured by split post dielectric resonator at 10 GHz.
HIPS Average Minimum Maximum
Thickness 235.7µm 234µm 238µm
Permittivity 2.5112 2.4969 2.5220
Loss Tangent 8.04769E-4 8.01687E-4 8.07047E-4

Download the HIPS measurement data.

Fabry-Perot Open Resonator

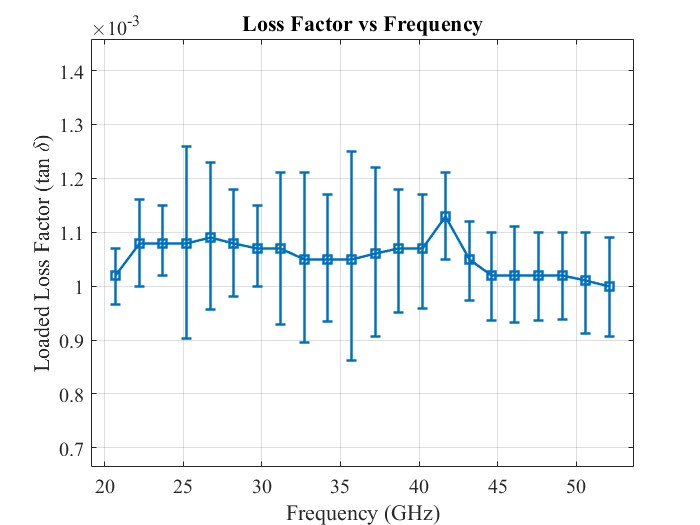
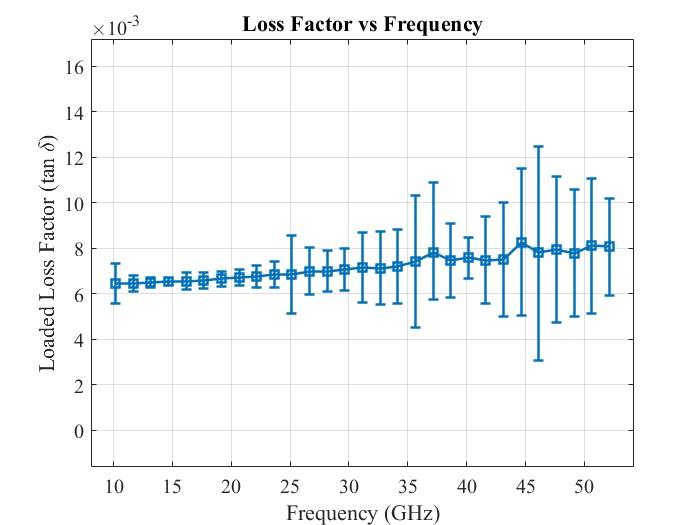
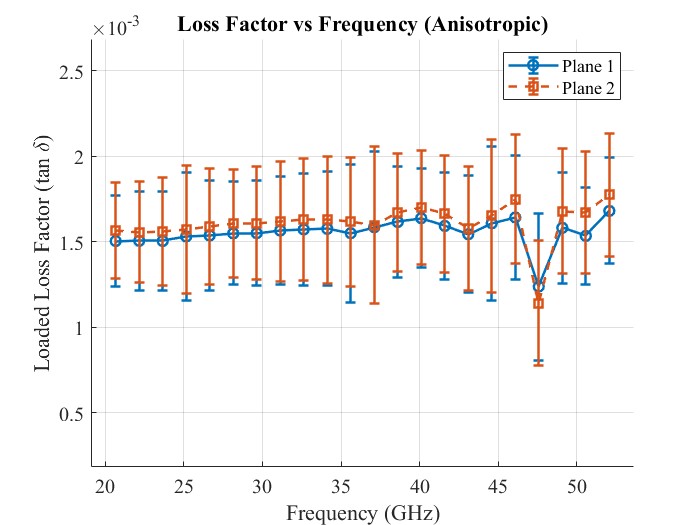
The FPOR has a range from 10.2GHz to 52.2GHz. Dk uncertainty bars are due to thickness uncertainty and Df uncertainty bars are due to signal-to-noise ratio.

► Cyclic Olefin Polymer (COP) – 20.7GHz to 52.2GHz – 99.7µm

COP is a transparent plastic resin with very low water absorption and loss tangent. This sample is a 99.7µm film of COP and typically has a real permittivity between 2.1 and 2.4.

Measured dielectric constant of a 99.7 micrometre cyclic olefin polymer (COP) film plotted against frequency from 20.7 to 52.2 GHz by Fabry-Perot open resonator. The uncertainty bars come from thickness uncertainty.
Measured loss tangent of a 99.7 micrometre cyclic olefin polymer (COP) film plotted against frequency from 20.7 to 52.2 GHz by Fabry-Perot open resonator. The uncertainty bars come from signal-to-noise ratio.

Download the COP wideband measurement data, or see wideband FPOR dielectric constant testing for sample requirements and pricing.

► Polyvinyl Chloride (PVC) – 10.2GHz to 52.2GHz – 146.6µm

PVC is a common synthetic plastic. This sample has an expected real permittivity of 2.68 and loss tangent of 0.008.
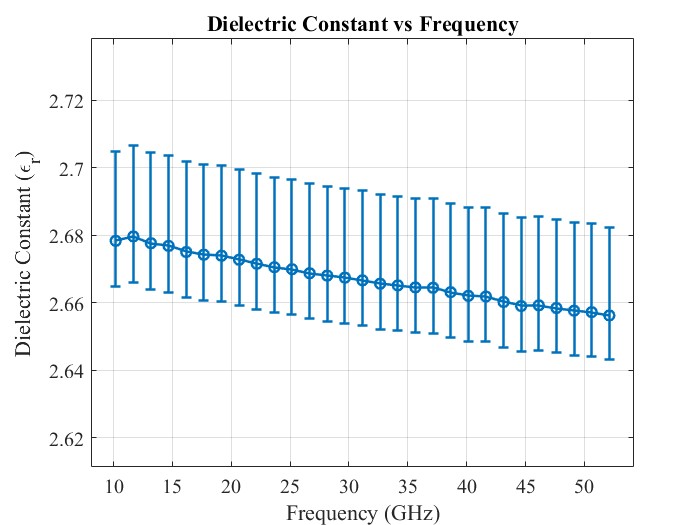
Measured dielectric constant of a 146.6 micrometre polyvinyl chloride (PVC) film plotted against frequency from 10.2 to 52.2 GHz by Fabry-Perot open resonator. The uncertainty bars come from thickness uncertainty.
Measured loss tangent of a 146.6 micrometre polyvinyl chloride (PVC) film plotted against frequency from 10.2 to 52.2 GHz by Fabry-Perot open resonator. The uncertainty bars come from signal-to-noise ratio.

Download the PVC wideband measurement data.

► High Impact Polystyrene (HIPS) – 20.7GHz to 52.2GHz – 246.2µm

This sample of HIPS is anisotropic and has properties of high impact strength. It is a low-cost, rigid thermoplastic with good dimensional stability and an expected real permittivity of 2.51.
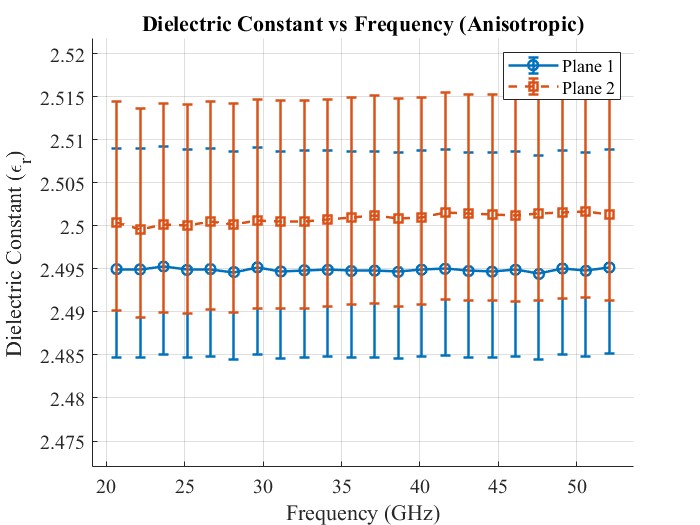
Measured dielectric constant of a 246.2 micrometre high impact polystyrene (HIPS) film plotted against frequency from 20.7 to 52.2 GHz by Fabry-Perot open resonator. This sample is anisotropic. The uncertainty bars come from thickness uncertainty.
Measured loss tangent of a 246.2 micrometre high impact polystyrene (HIPS) film plotted against frequency from 20.7 to 52.2 GHz by Fabry-Perot open resonator. The uncertainty bars come from signal-to-noise ratio.

Browse all FPOR measurement data.

iEMSL Logo

Intelligent Electromagnetic Sensor Laboratories (iEMSL)
Texas A&M University

188 Bizzell St,
College Station, Texas, USA 77843

EmailLinkedInYouTubeMaps

Quick Links

  • •Measurement Services

    • •Antenna Measurement Services
    • •Electromagnetic Material Characterization Services
    • •S-Parameters and System-Level Testing
  • •Equipment
  • •iEMSL App

© 2015-2025 Intelligent Electromagnetic Sensor Laboratories (iEMSL) · All Rights Reserved
Log in

Texas A&M Engineering Experiment Station Logo